Redesigning the Reporting Architecture
From migrating legacy reports to a shared architecture for querying, customizing and exporting information.
Ticket Edenred needed to migrate TEP, its legacy portal, to Ticket Portal, which served small businesses and needed to incorporate features used by mid-sized and large clients, including Top Accounts. Reporting, used by HR, Finance and Administrative teams, was essential to shutting down the old architecture.
The project began with a proposal to reproduce the 18 existing reports in three months. When the originally assigned designer left, I took on design leadership in an initiative with no squad and no engineering. With the GPM, I investigated the current experience and client needs to structure the new proposal, during the first and second quarters of 2026.
Migrating reports without reproducing the legacy's limitations
The initial scope was to bring the 18 TEP reports to Ticket Portal as they were. Research revealed a fragmented experience, with fixed structures, little customization and heavy reliance on exports. It also revealed needs from large clients that Operations handled manually, outside the portal.
Fragmented reports
Each report had its own screen, filters and structure. Similar needs showed up in different experiences, with inconsistent organization and presentation.
Limited querying flexibility
Fixed tables and limited filters restricted the available views. Exporting to XLSX or PDF was the primary way to work with the data, and some results depended on asynchronous processing.
Needs outside self-service
Large Accounts and Top Accounts requested reports with specific fields, data breakdowns and formats. Operations extracted the data, adjusted spreadsheets and sent the files manually.
A shared architecture for working with information
We reorganized the needs into four main groups: Orders and Tax Documents, Beneficiaries, Cards and Reversals. The proposal shared components and an interaction model across domains, while preserving each one's own data, filters and rules.
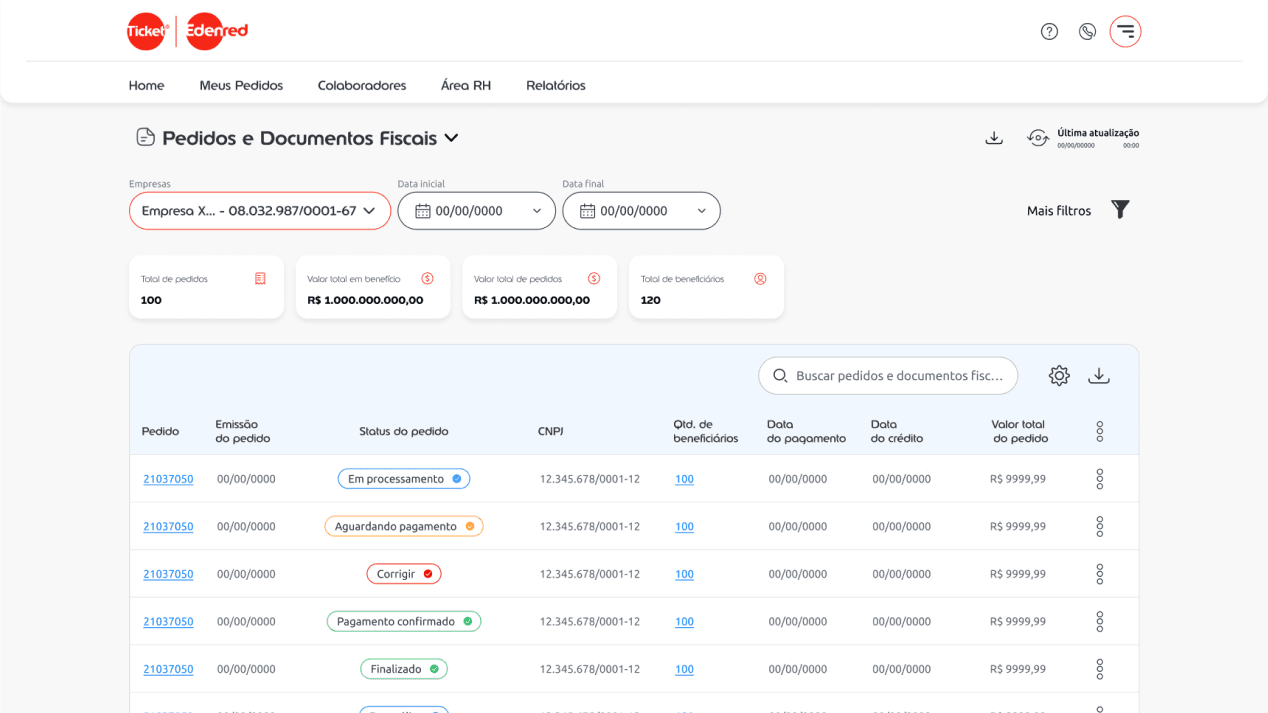
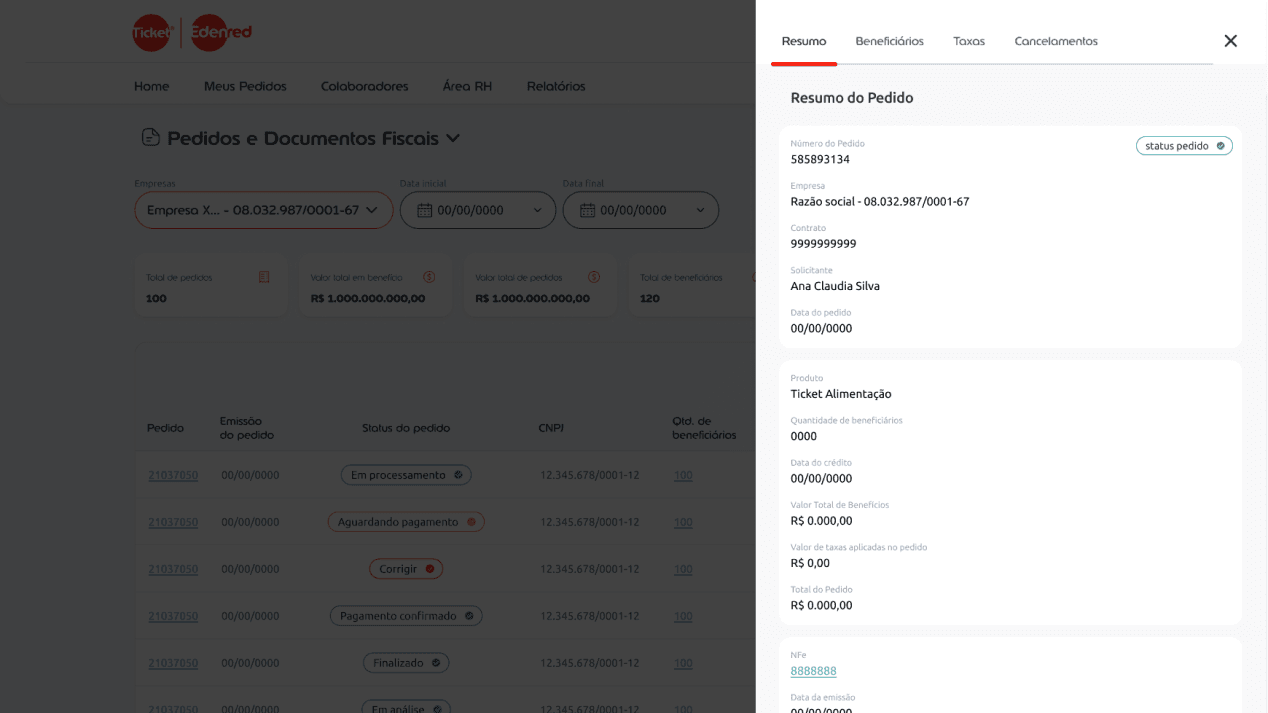
The experience combines search, filters, totals, column configuration, detail views and export. The shift was from choosing among fixed reports to querying and organizing information within the possibilities the product offers.
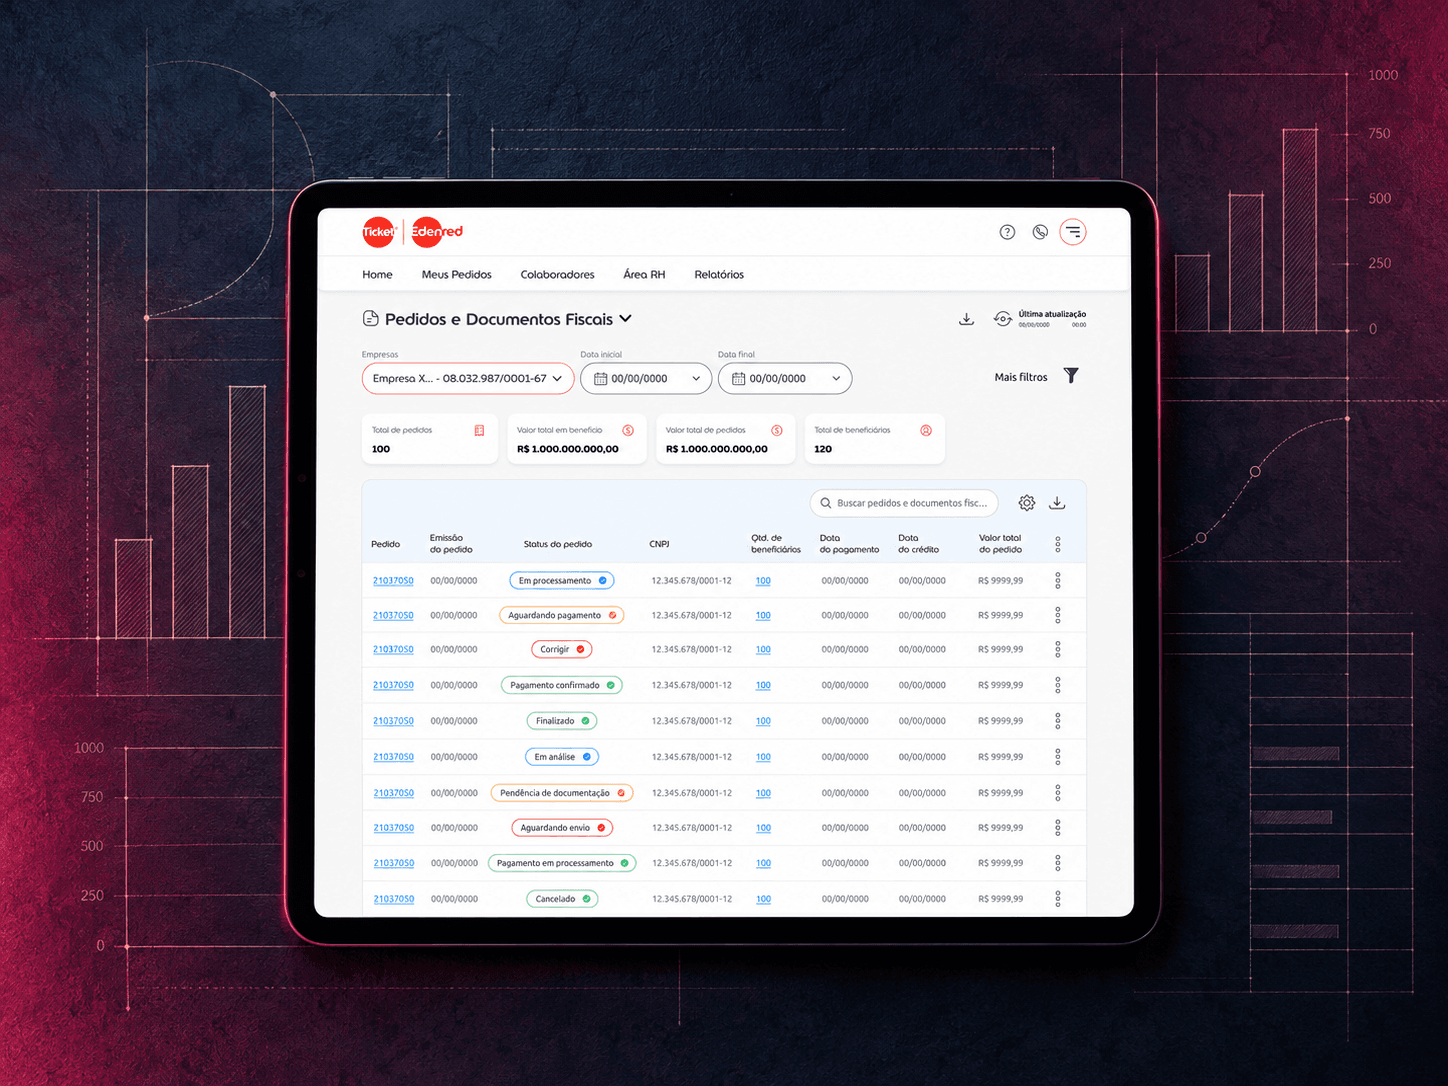
Project Guidelines
Domain-based organization
Bring similar needs together in a unified architecture, with components shared across Orders, Beneficiaries, Cards and Reversals.
Flexibility for different needs
Support different data views through primary and advanced filters, saved filters, and column selection, sorting and reordering.
Exploration within the portal
Offer totals, statuses, filtered summaries and access to details to support understanding of the information while querying.
Continuity beyond the portal
Preserve table and detail exports for workflows that continue in other tools, with reusable formats and patterns depending on the context.
Design Process
We combined analysis of the existing experience, usage data, client needs and market research to reframe the scope. The proposal was prototyped, discussed with the teams involved and validated with clients before progressive rollout.
Understanding the legacy system and how it was used
I analyzed the 18 reports, their structures and limitations. Data on access, usage frequency, time spent and repeat visits helped identify usage concentration, overlapping needs and differences between segments.
Needs served outside the portal
With business managers, Operations and support tickets, we investigated recurring demands. Analyzing dozens of custom files, supported by an LLM, helped recognize relevant groups, filters and fields.
References and architecture definition
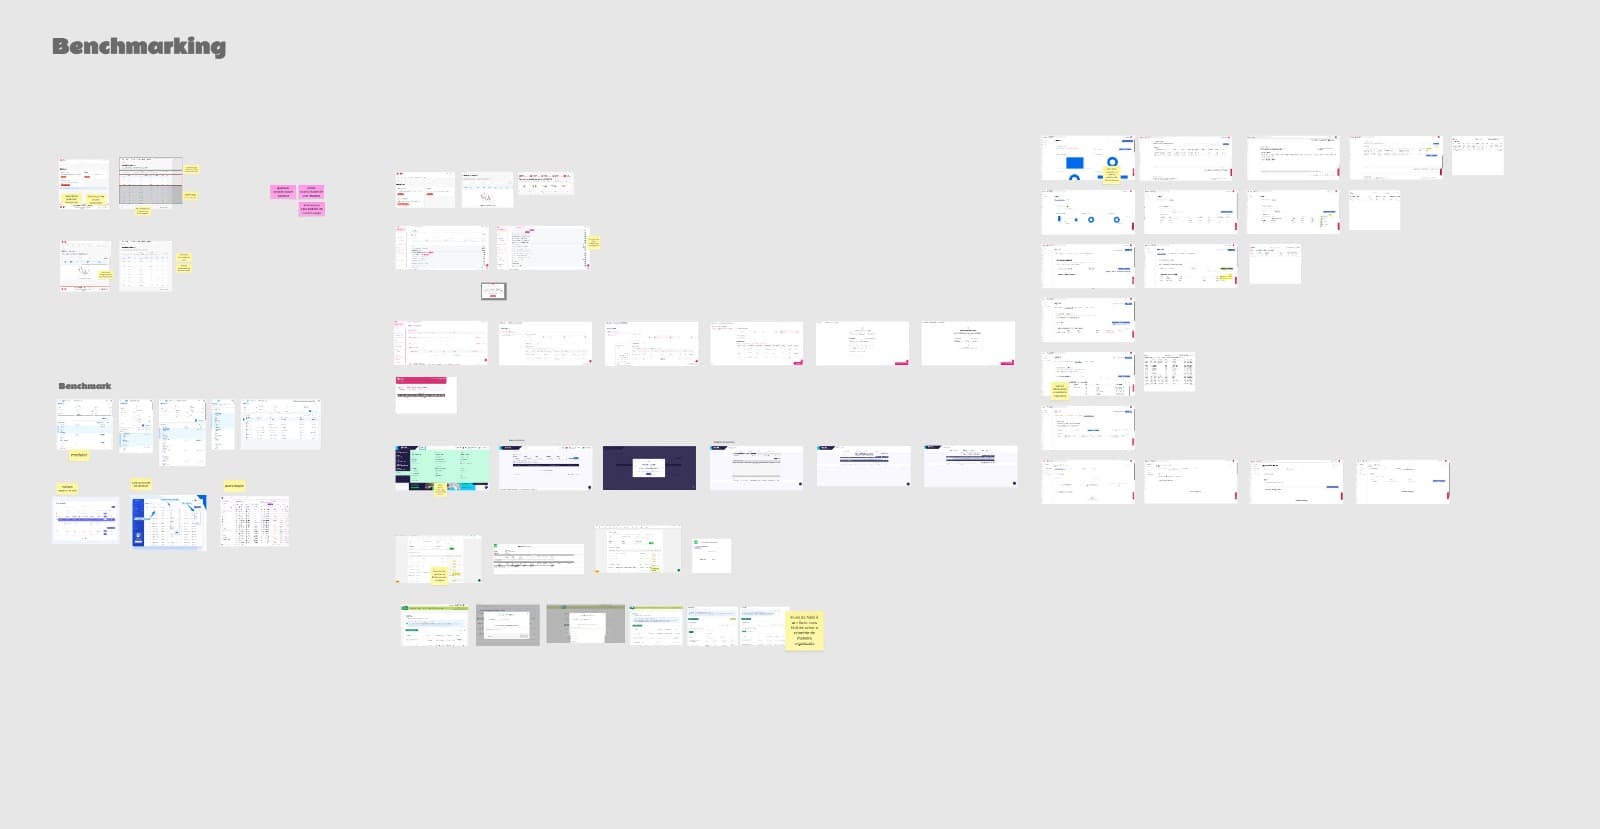
Manual benchmarking and LLM research complemented internal findings. The identified needs guided a domain-based architecture with flexible filters, customization, exploration and export.
Experience prototyping
The work moved through wireframes in Figma Design and prototypes with Figma Make and Google Antigravity. Datasets and interactions close to real use made it possible to explore complexity beyond static screens.
Alignment and validation
The proposal was aligned with the tribe, engineering, data, leadership and management. Usability testing involved five clients: two large, two mid-sized and one small.
Adoption support and monitoring
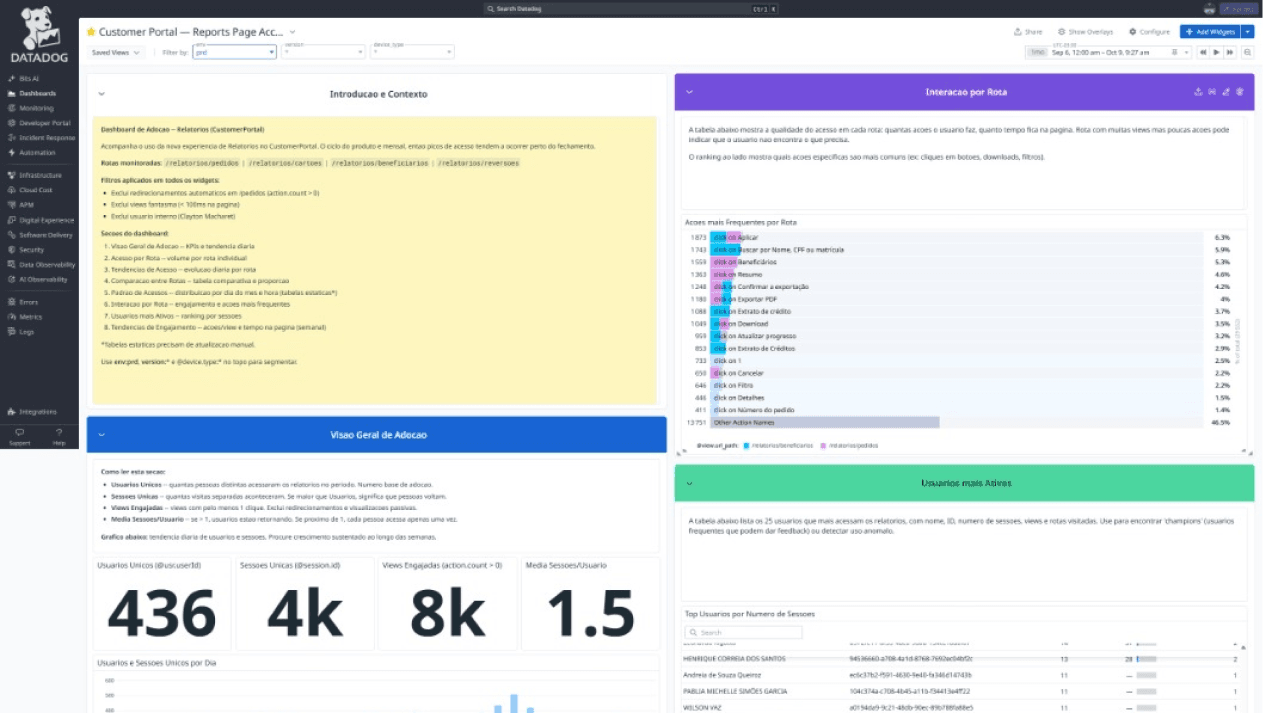
We structured guidance for clients and internal teams, a feedback channel and a controlled pilot. Since instrumentation had not been planned, I used the monitoring tool's AI assistant to track the expansion, building queries and dashboards for behavior and performance.
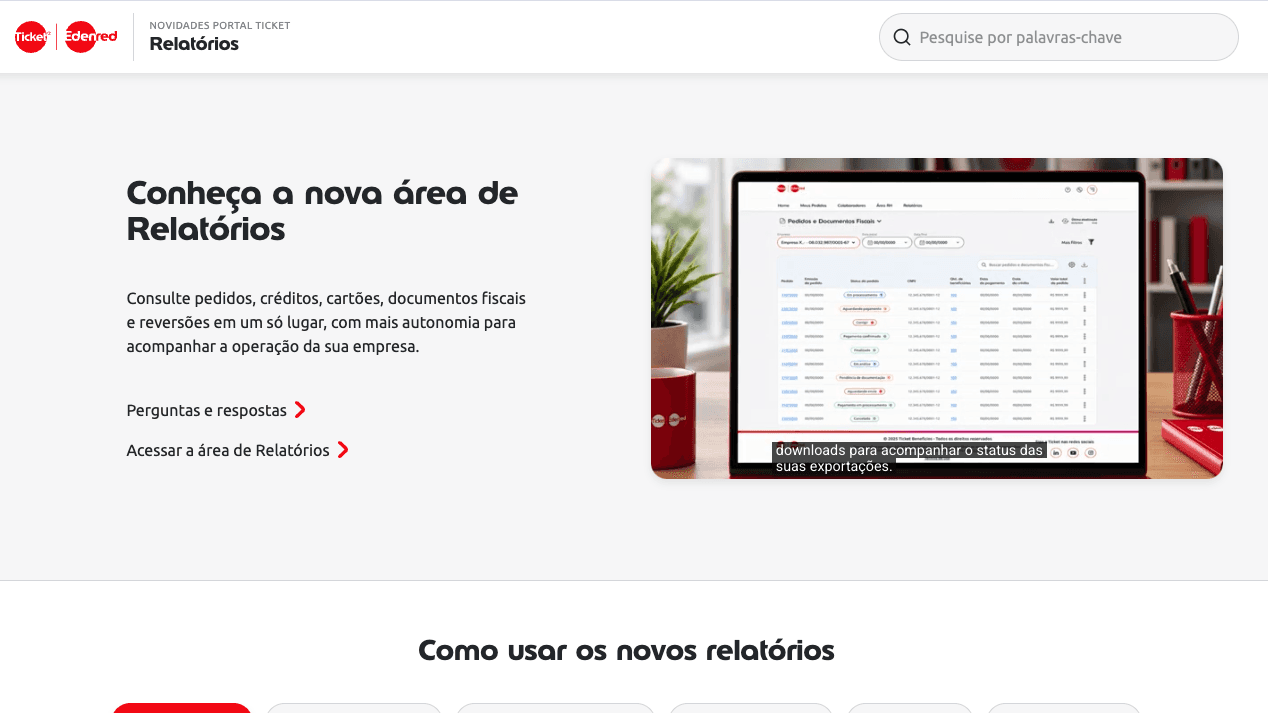
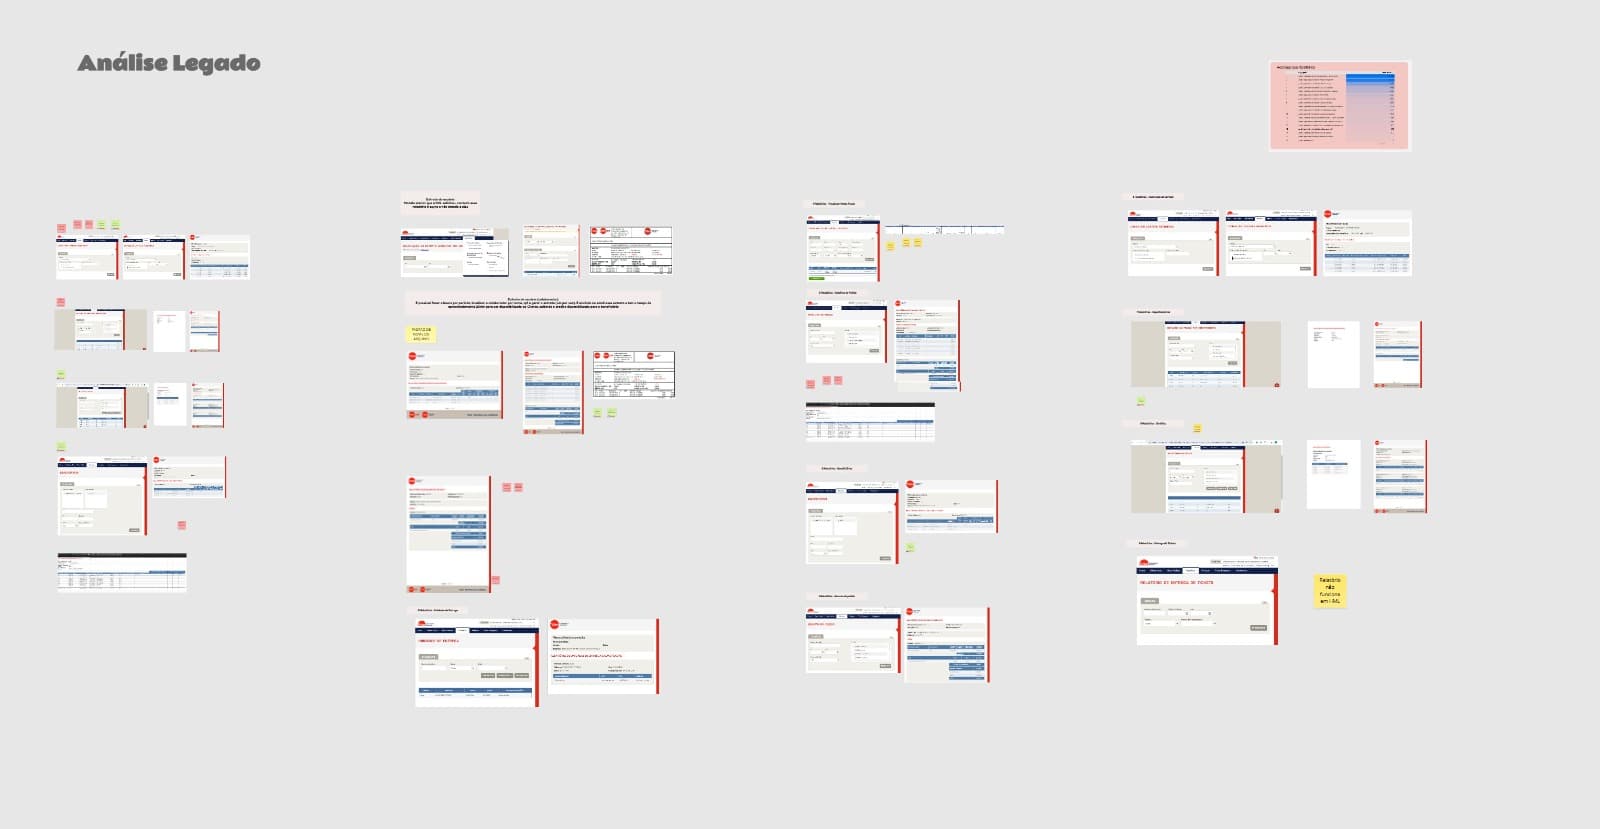 Legacy analysis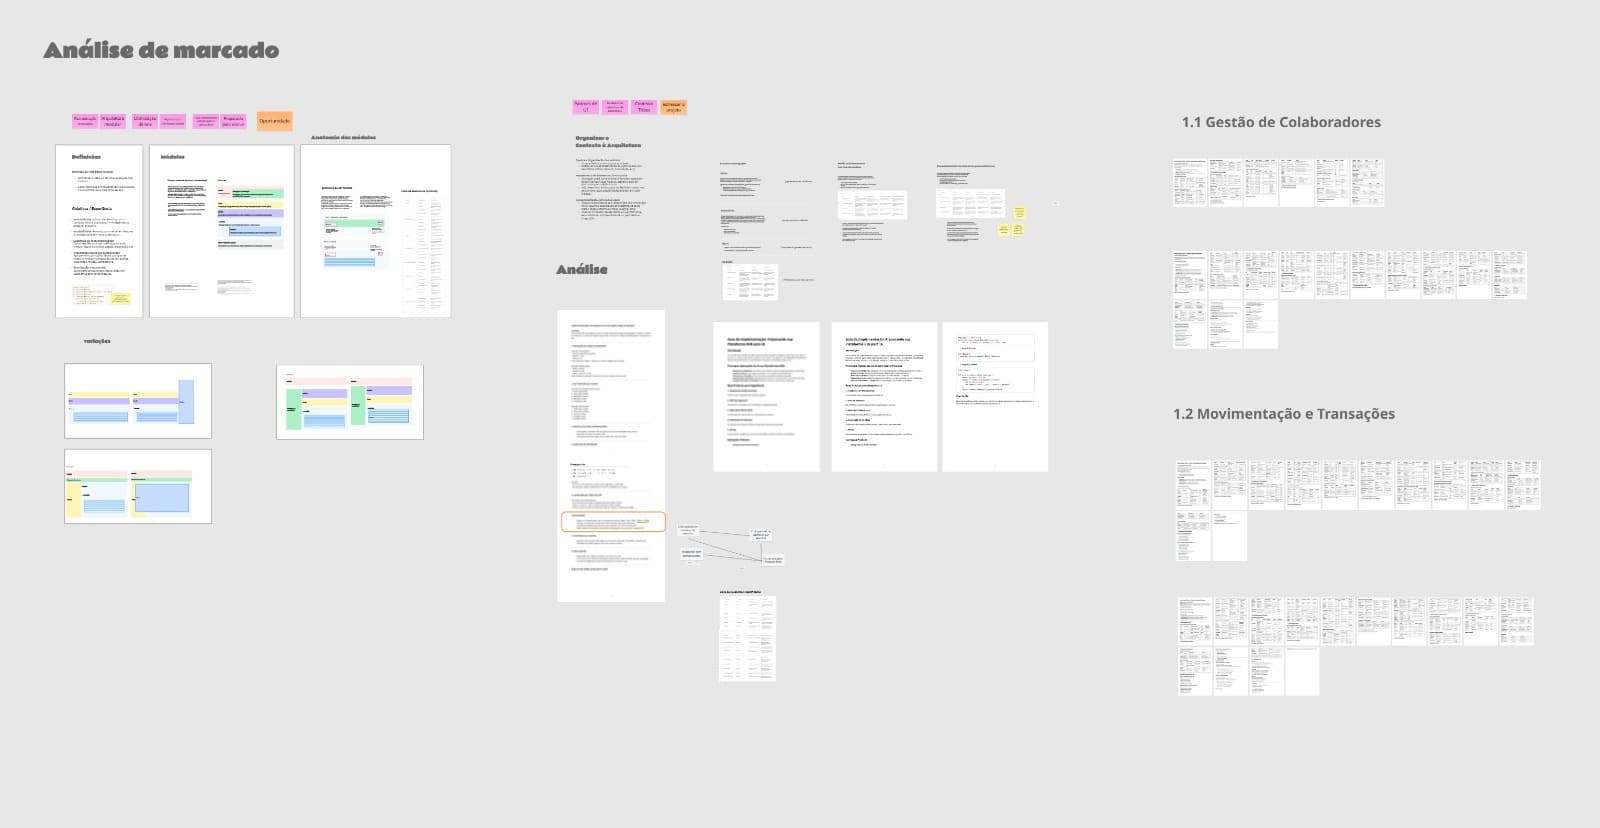
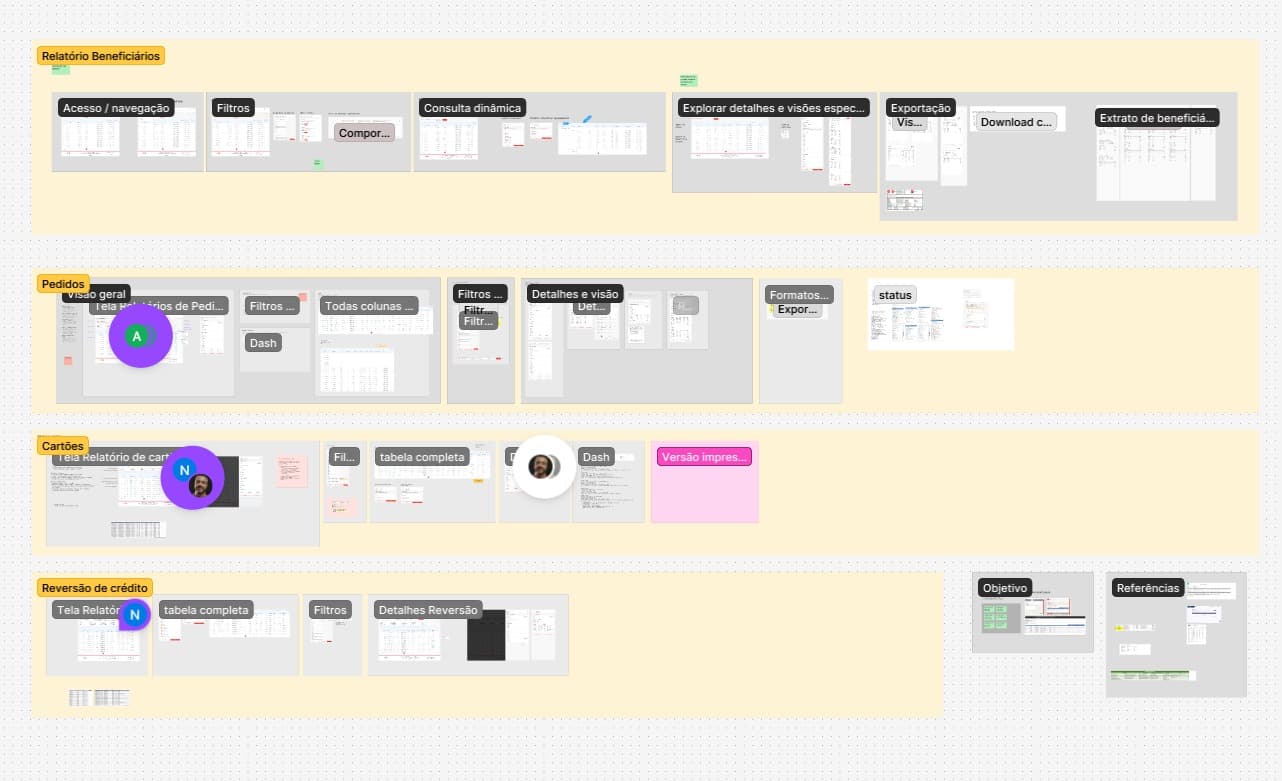
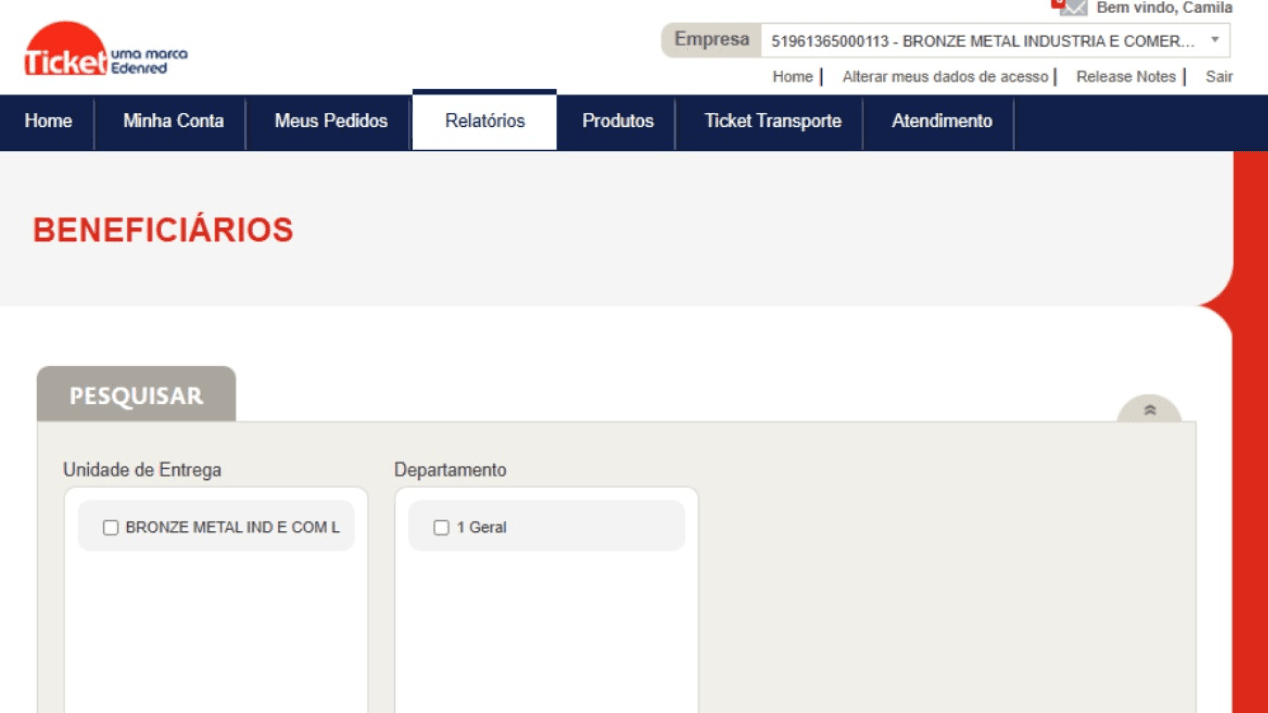
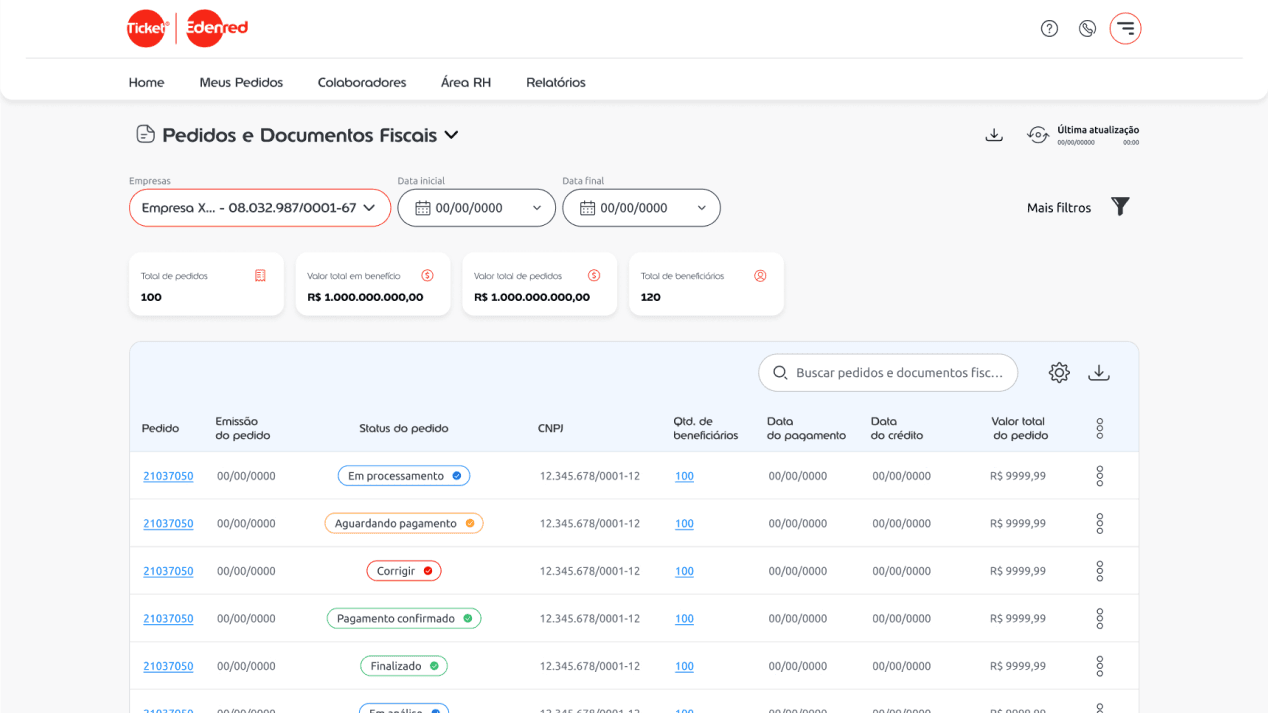
Drag sideways to compare the experiences
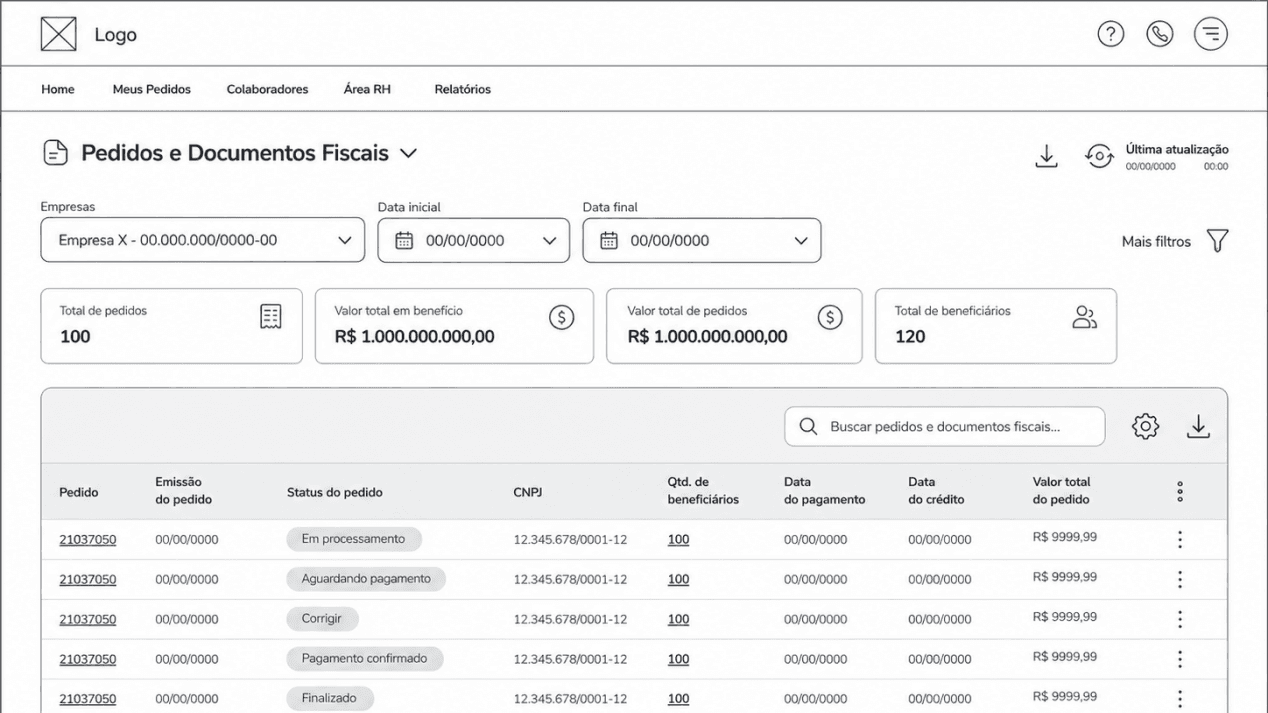 Wireframe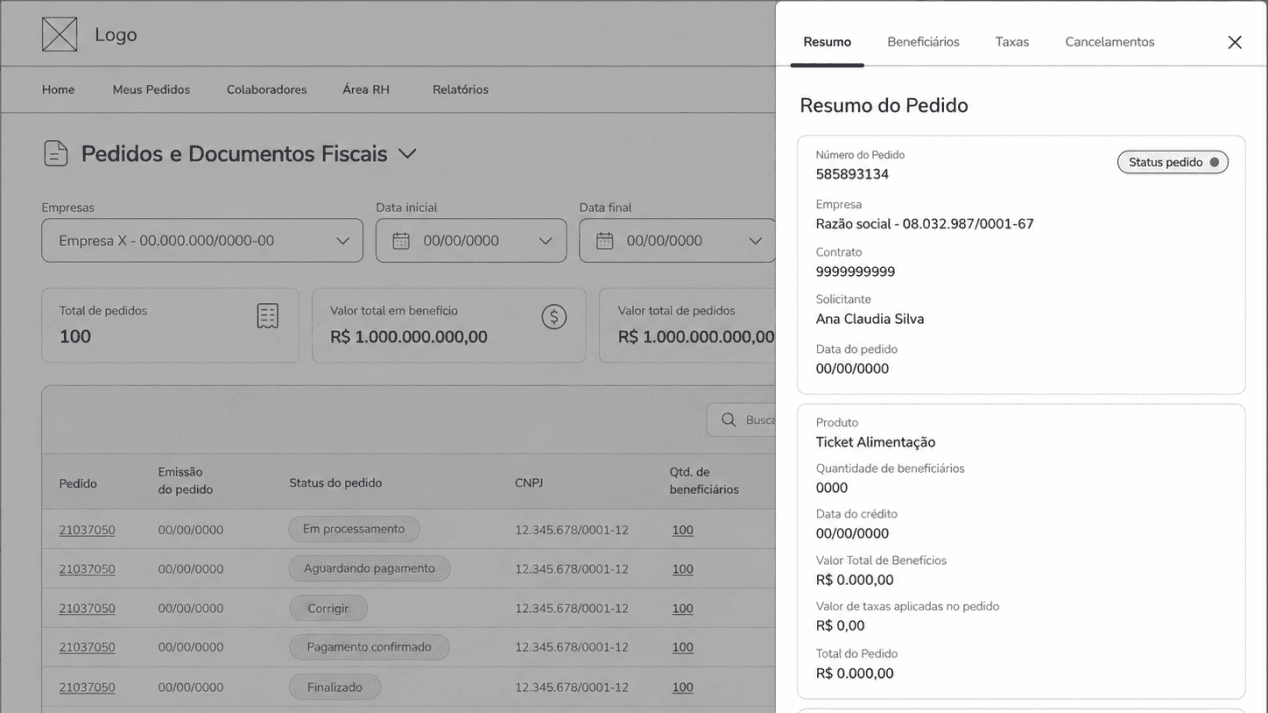
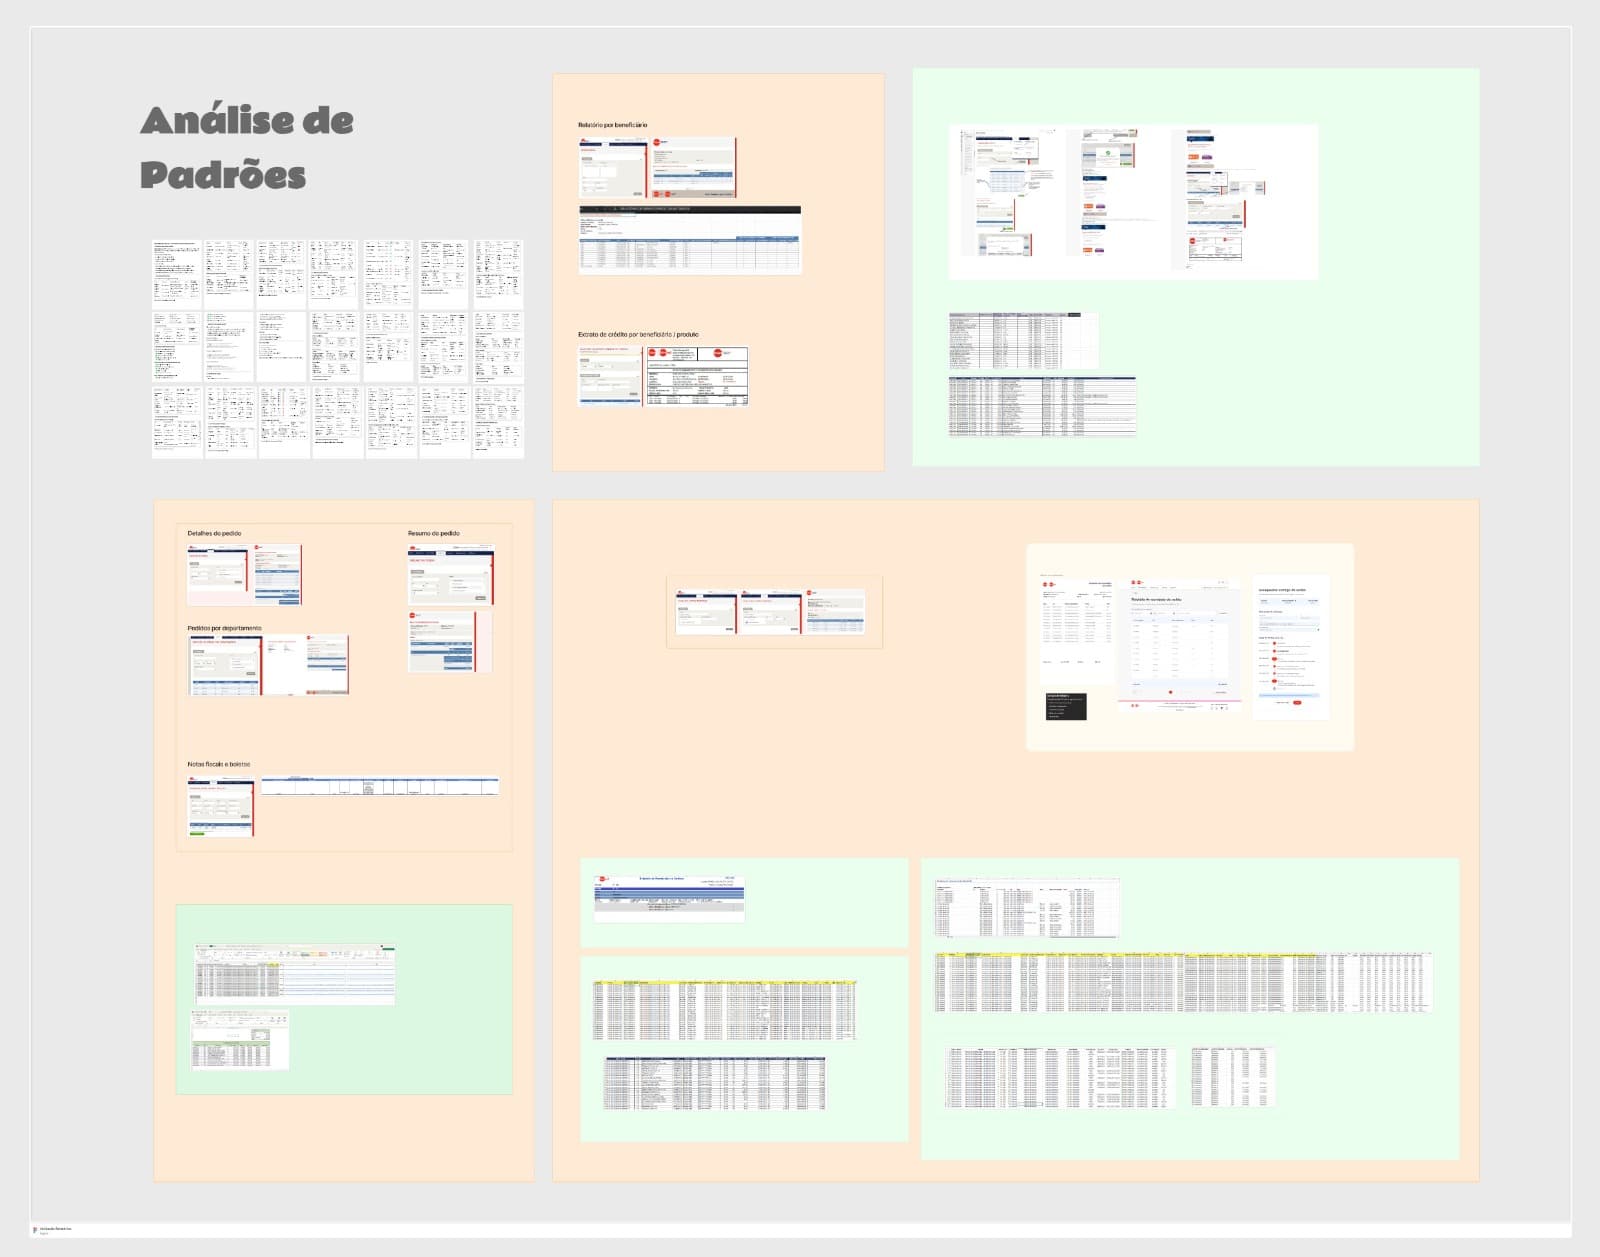 Pattern analysis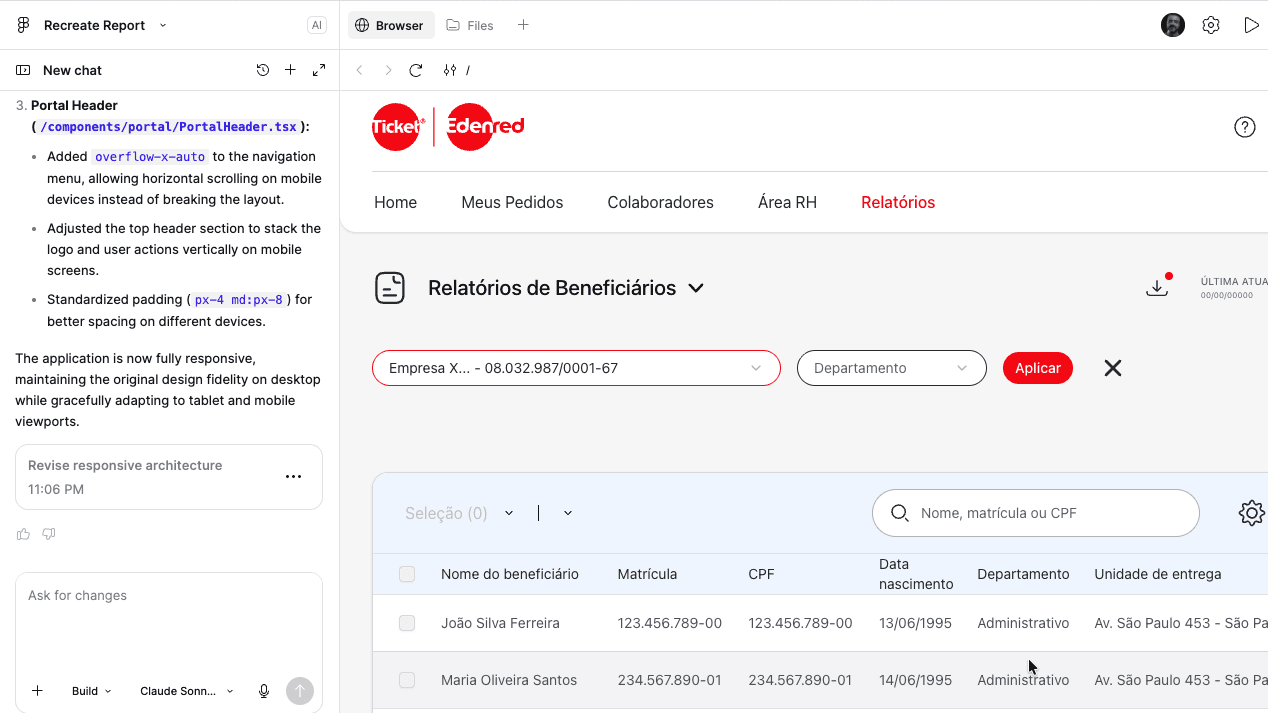

Observed Results
Of the base enabled
The module reached 41,303 clients, with progressive rollout after the pilot.
Shared architecture
Orders and Tax Documents, Beneficiaries, Cards and Reversals now share one querying, customization and export model.
Controlled pilot
Product, Operations and business managers closely monitored the initial release before the rollout expanded.
As of September 22, 2026. Enablement means access granted to the module; full migration and actual usage are not demonstrated by this indicator.
What This Project Taught Me
Migration requires understanding what must keep working
While investigating the 18 reports, I learned to separate client needs from legacy structures. This made it possible to reorganize the experience by domain, preserving important tasks while expanding querying possibilities.
Low usage can hide a need met outside the product
Lower usage among large clients took on a different meaning once we analyzed the files produced by Operations. I learned to cross-reference navigation data with support requests to see needs the portal wasn't recording.
Measurement should be planned alongside the solution
The expansion revealed an instrumentation gap, which we tried to work around with queries and dashboards in the monitoring tool. In future projects, I would define from the start the events and criteria to track usage, task completion and difficulties during the transition.